
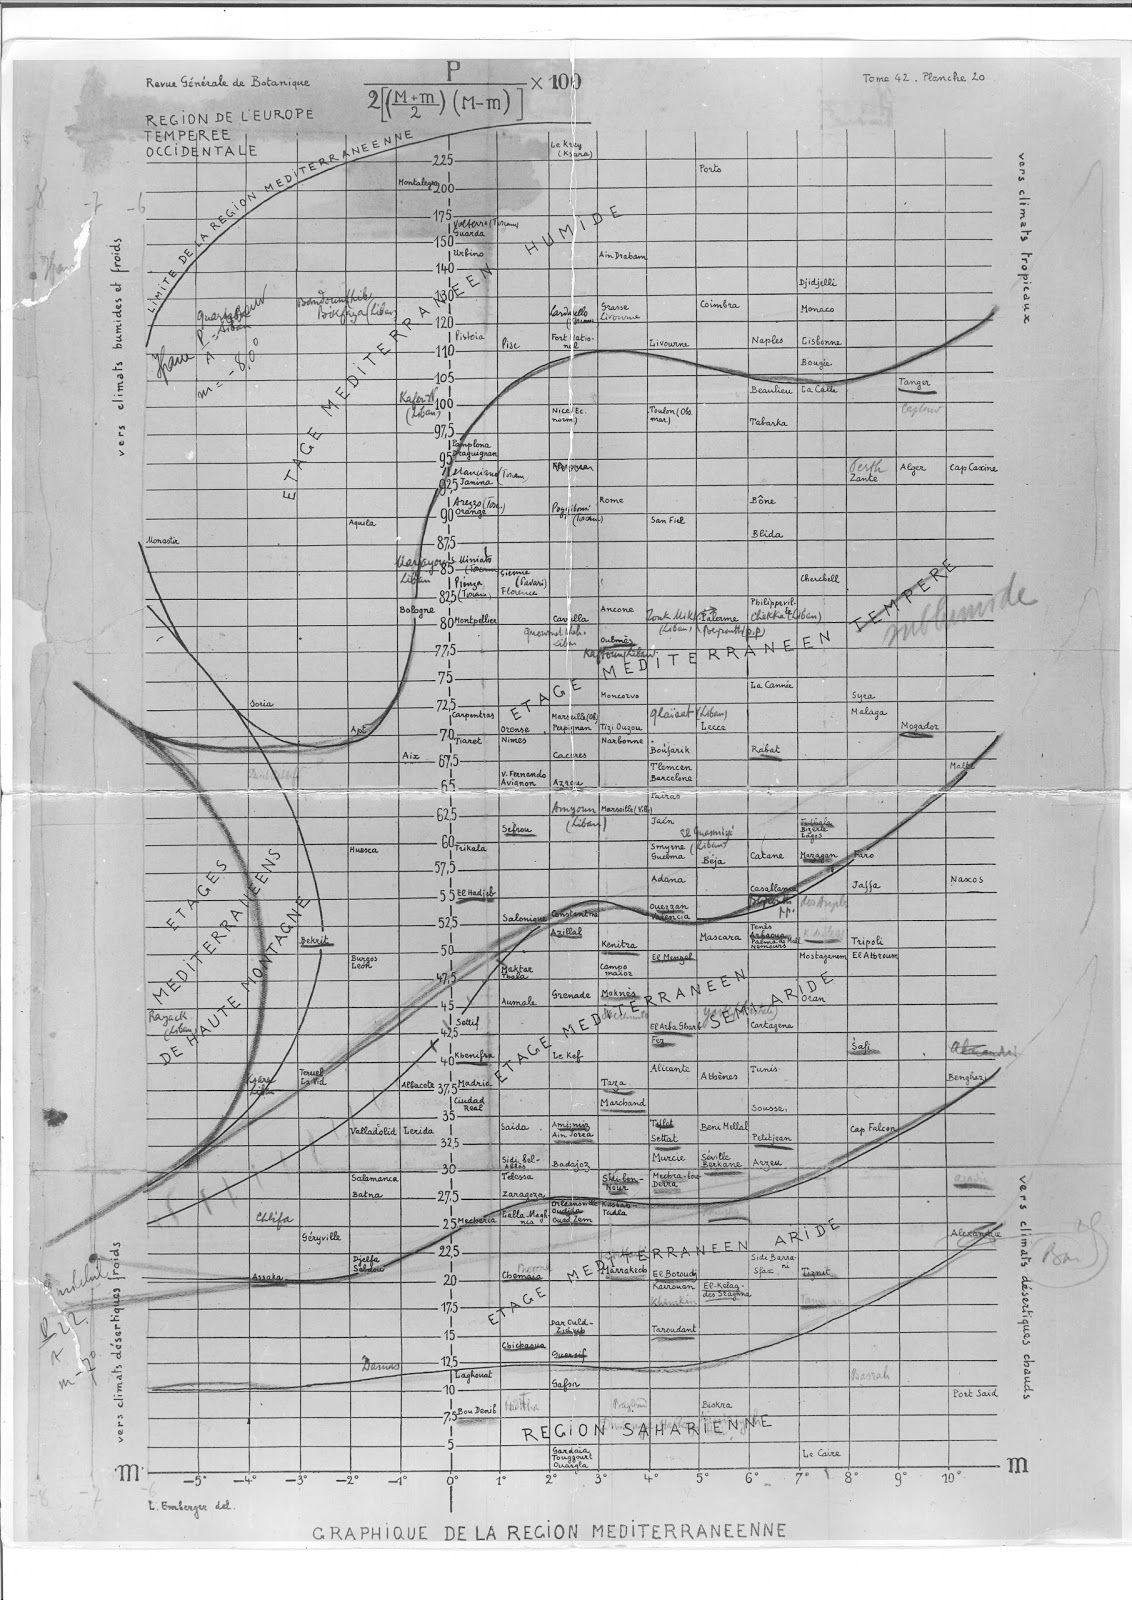
For example, the plot below is his published diagram showing minimum temperature of the coolest month versus a 'pluviometric quotient' capturing several aspects of temperature and precipitation from:
Emberger; La végétation de la région méditerranienne. Rev. Gén. Bot., 42 (1930)
So it's fascinating to see the eraser marks and crossed out lines, this visualisation of scientific uncertainty. The final message from this probably depends on your perspective and personality:
- Does it show that plant-environment modelling has changed a lot or that plant environmental modelling is still asking about the same underlying processes in similar ways?
- Does this highlight the value of expert knowledge (still cited) or the limitations of expert knowledge (eraser marks)?

E.g. updated in Hobbs, Richard J., D. M. Richardson, and G. W. Davis. "Mediterranean-type ecosystems: opportunities and constraints for studying the function of biodiversity." Mediterranean-Type Ecosystems. Springer Berlin Heidelberg, 1995. 1-42.
Thanks to Eric Garnier, for finding and sharing the original Emberger diagram and the more recent versions.
2 comments:
We have the equivalent of erased marks in every computer statistical model - only we are often not unaware of it
moreover I think the lesson is that modeling of vegetation is higly nonlinear (the sinous lines), something we can account in our models but often do not
Absolutely.
Post a Comment